
Proxmox VE 与DCPMM
我心心念念的dcpmm 终于大船靠岸了。
今年4月买了2个板子+es的dcpmm。主板点不亮,拿去卖家,折腾2个月,发现是带载调压,换了电源之后,顺利亮机。
我们先看数据,内存用的2x16G 2133。CPU是QQ8Q。dcpmm是128g ES
随机读取
fio -filename=/dev/pmem0 -direct=1 -iodepth 1 -thread -rw=randread -ioengine=io_uring -bs=4k -size=1000G -n
umjobs=50 -runtime=180 -group_reporting -name=rand_read_4k
rand_read_4k: (g=0): rw=randread, bs=(R) 4096B-4096B, (W) 4096B-4096B, (T) 4096B-4096B, ioengine=io_uring, iodepth=1
...
fio-3.25
Starting 50 threads
Jobs: 50 (f=50): [r(50)][100.0%][r=4002MiB/s][r=1025k IOPS][eta 00m:00s]
rand_read_4k: (groupid=0, jobs=50): err= 0: pid=14365: Sun Jun 19 16:13:29 2022
  read: IOPS=1007k, BW=3935MiB/s (4127MB/s)(692GiB/180001msec)
    slat (nsec): min=595, max=21751k, avg=3523.74, stdev=3388.45
    clat (nsec): min=70, max=25821k, avg=44705.82, stdev=21313.59
     lat (usec): min=5, max=25823, avg=48.38, stdev=21.51
    clat percentiles (usec):
     |  1.00th=[   20],  5.00th=[   23], 10.00th=[   26], 20.00th=[   30],
     | 30.00th=[   34], 40.00th=[   37], 50.00th=[   41], 60.00th=[   45],
     | 70.00th=[   50], 80.00th=[   58], 90.00th=[   70], 95.00th=[   82],
     | 99.00th=[  110], 99.50th=[  121], 99.90th=[  149], 99.95th=[  163],
     | 99.99th=[  198]
   bw (  MiB/s): min= 3433, max= 4102, per=100.00%, avg=3941.50, stdev= 2.59, samples=17950
   iops        : min=878850, max=1050099, avg=1009015.28, stdev=663.42, samples=17950
  lat (nsec)   : 100=0.01%, 250=0.01%, 500=0.01%, 750=0.01%, 1000=0.01%
  lat (usec)   : 2=0.01%, 4=0.01%, 10=0.01%, 20=1.52%, 50=68.53%
  lat (usec)   : 100=28.24%, 250=1.70%, 500=0.01%, 750=0.01%, 1000=0.01%
  lat (msec)   : 2=0.01%, 4=0.01%, 10=0.01%, 20=0.01%, 50=0.01%
  cpu          : usr=5.67%, sys=16.34%, ctx=181340281, majf=0, minf=0
  IO depths    : 1=100.0%, 2=0.0%, 4=0.0%, 8=0.0%, 16=0.0%, 32=0.0%, >=64=0.0%
     submit    : 0=0.0%, 4=100.0%, 8=0.0%, 16=0.0%, 32=0.0%, 64=0.0%, >=64=0.0%
     complete  : 0=0.0%, 4=100.0%, 8=0.0%, 16=0.0%, 32=0.0%, 64=0.0%, >=64=0.0%
     issued rwts: total=181343665,0,0,0 short=0,0,0,0 dropped=0,0,0,0
     latency   : target=0, window=0, percentile=100.00%, depth=1

Run status group 0 (all jobs):
   READ: bw=3935MiB/s (4127MB/s), 3935MiB/s-3935MiB/s (4127MB/s-4127MB/s), io=692GiB (743GB), run=180001-180001msec
随机写入
fio -filename=/dev/pmem0 -direct=1 -iodepth 1 -thread -rw=randwrite -ioengine=io_uring -bs=4k -size=1000G -numjobs=50 -runtime=180 -group_reporting -name=rand_write_4k
rand_write_4k: (g=0): rw=randwrite, bs=(R) 4096B-4096B, (W) 4096B-4096B, (T) 4096B-4096B, ioengine=io_uring, iodepth=1
...
fio-3.25
Starting 50 threads
Jobs: 50 (f=50): [w(50)][100.0%][w=195MiB/s][w=49.9k IOPS][eta 00m:00s]
rand_write_4k: (groupid=0, jobs=50): err= 0: pid=15878: Sun Jun 19 16:21:26 2022
  write: IOPS=50.1k, BW=196MiB/s (205MB/s)(34.4GiB/180001msec); 0 zone resets
    slat (nsec): min=479, max=25145k, avg=40702.78, stdev=127415.74
    clat (nsec): min=83, max=28977k, avg=950992.20, stdev=641847.90
     lat (usec): min=8, max=28978, avg=992.30, stdev=681.07
    clat percentiles (usec):
     |  1.00th=[  227],  5.00th=[  310], 10.00th=[  363], 20.00th=[  449],
     | 30.00th=[  545], 40.00th=[  660], 50.00th=[  783], 60.00th=[  914],
     | 70.00th=[ 1090], 80.00th=[ 1336], 90.00th=[ 1762], 95.00th=[ 2212],
     | 99.00th=[ 3261], 99.50th=[ 3752], 99.90th=[ 4817], 99.95th=[ 5276],
     | 99.99th=[ 6456]
   bw (  KiB/s): min=176947, max=224181, per=100.00%, avg=200350.79, stdev=157.90, samples=17950
   iops        : min=44233, max=56031, avg=50078.77, stdev=39.36, samples=17950
  lat (nsec)   : 100=0.01%, 250=0.01%, 500=0.01%, 750=0.01%, 1000=0.01%
  lat (usec)   : 2=0.01%, 4=0.01%, 10=0.01%, 20=0.01%, 50=0.03%
  lat (usec)   : 100=0.03%, 250=1.61%, 500=23.86%, 750=21.56%, 1000=18.27%
  lat (msec)   : 2=27.75%, 4=6.55%, 10=0.34%, 20=0.01%, 50=0.01%
  cpu          : usr=1.52%, sys=11.55%, ctx=9091878, majf=0, minf=0
  IO depths    : 1=100.0%, 2=0.0%, 4=0.0%, 8=0.0%, 16=0.0%, 32=0.0%, >=64=0.0%
     submit    : 0=0.0%, 4=100.0%, 8=0.0%, 16=0.0%, 32=0.0%, 64=0.0%, >=64=0.0%
     complete  : 0=0.0%, 4=100.0%, 8=0.0%, 16=0.0%, 32=0.0%, 64=0.0%, >=64=0.0%
     issued rwts: total=0,9010769,0,0 short=0,0,0,0 dropped=0,0,0,0
     latency   : target=0, window=0, percentile=100.00%, depth=1

Run status group 0 (all jobs):
  WRITE: bw=196MiB/s (205MB/s), 196MiB/s-196MiB/s (205MB/s-205MB/s), io=34.4GiB (36.9GB), run=180001-180001msec

Disk stats (read/write):
  pmem0: ios=0/0, merge=0/0, ticks=0/0, in_queue=0, util=0.00%
顺序读取
 fio -filename=/dev/pmem0 -direct=1 -iodepth 1 -thread -rw=read -ioengine=io_uring -bs=4k -size=1000G -numjo
bs=50 -runtime=180 -group_reporting -name=read_4k
read_4k: (g=0): rw=read, bs=(R) 4096B-4096B, (W) 4096B-4096B, (T) 4096B-4096B, ioengine=io_uring, iodepth=1
...
fio-3.25
Starting 50 threads
Jobs: 50 (f=50): [R(50)][100.0%][r=6908MiB/s][r=1768k IOPS][eta 00m:00s]
read_4k: (groupid=0, jobs=50): err= 0: pid=16704: Sun Jun 19 16:25:05 2022
  read: IOPS=1804k, BW=7047MiB/s (7389MB/s)(1239GiB/180001msec)
    slat (nsec): min=576, max=12841k, avg=3836.64, stdev=2689.06
    clat (nsec): min=77, max=23477k, avg=22927.07, stdev=14368.89
     lat (usec): min=4, max=23479, avg=26.85, stdev=14.97
    clat percentiles (usec):
     |  1.00th=[    8],  5.00th=[   10], 10.00th=[   11], 20.00th=[   12],
     | 30.00th=[   14], 40.00th=[   18], 50.00th=[   21], 60.00th=[   23],
     | 70.00th=[   27], 80.00th=[   33], 90.00th=[   41], 95.00th=[   48],
     | 99.00th=[   66], 99.50th=[   74], 99.90th=[   93], 99.95th=[  101],
     | 99.99th=[  125]
   bw (  MiB/s): min= 6593, max= 7592, per=100.00%, avg=7052.28, stdev= 3.51, samples=17950
   iops        : min=1687818, max=1943600, avg=1805383.19, stdev=899.83, samples=17950
  lat (nsec)   : 100=0.01%, 250=0.01%, 500=0.01%, 750=0.01%
  lat (usec)   : 2=0.01%, 4=0.01%, 10=9.24%, 20=40.43%, 50=46.23%
  lat (usec)   : 100=4.06%, 250=0.05%, 500=0.01%, 750=0.01%, 1000=0.01%
  lat (msec)   : 2=0.01%, 4=0.01%, 10=0.01%, 20=0.01%, 50=0.01%
  cpu          : usr=7.01%, sys=29.10%, ctx=324720874, majf=0, minf=0
  IO depths    : 1=100.0%, 2=0.0%, 4=0.0%, 8=0.0%, 16=0.0%, 32=0.0%, >=64=0.0%
     submit    : 0=0.0%, 4=100.0%, 8=0.0%, 16=0.0%, 32=0.0%, 64=0.0%, >=64=0.0%
     complete  : 0=0.0%, 4=100.0%, 8=0.0%, 16=0.0%, 32=0.0%, 64=0.0%, >=64=0.0%
     issued rwts: total=324718490,0,0,0 short=0,0,0,0 dropped=0,0,0,0
     latency   : target=0, window=0, percentile=100.00%, depth=1

Run status group 0 (all jobs):
   READ: bw=7047MiB/s (7389MB/s), 7047MiB/s-7047MiB/s (7389MB/s-7389MB/s), io=1239GiB (1330GB), run=180001-180001msec

Disk stats (read/write):
  pmem0: ios=0/0, merge=0/0, ticks=0/0, in_queue=0, util=0.00%
顺序写入
 fio -filename=/dev/pmem0 -direct=1 -iodepth 1 -thread -rw=write -ioengine=io_uring -bs=4k -size=1000G -numjobs=50 -runtime=180 -group_reporting -name=write_4k
write_4k: (g=0): rw=write, bs=(R) 4096B-4096B, (W) 4096B-4096B, (T) 4096B-4096B, ioengine=io_uring, iodepth=1
...
fio-3.25
Starting 50 threads
Jobs: 50 (f=50): [W(50)][100.0%][w=197MiB/s][w=50.4k IOPS][eta 00m:00s]
write_4k: (groupid=0, jobs=50): err= 0: pid=17650: Sun Jun 19 16:29:47 2022
  write: IOPS=50.4k, BW=197MiB/s (207MB/s)(34.6GiB/180004msec); 0 zone resets
    slat (nsec): min=431, max=5663.6k, avg=40335.98, stdev=125554.01
    clat (nsec): min=73, max=25723k, avg=945234.75, stdev=636737.51
     lat (usec): min=32, max=25725, avg=986.13, stdev=675.47
    clat percentiles (usec):
     |  1.00th=[  227],  5.00th=[  310], 10.00th=[  363], 20.00th=[  449],
     | 30.00th=[  545], 40.00th=[  660], 50.00th=[  783], 60.00th=[  914],
     | 70.00th=[ 1074], 80.00th=[ 1319], 90.00th=[ 1745], 95.00th=[ 2180],
     | 99.00th=[ 3261], 99.50th=[ 3720], 99.90th=[ 4752], 99.95th=[ 5276],
     | 99.99th=[ 6390]
   bw (  KiB/s): min=179094, max=225052, per=100.00%, avg=201898.85, stdev=157.16, samples=17950
   iops        : min=44772, max=56252, avg=50464.19, stdev=39.17, samples=17950
  lat (nsec)   : 100=0.01%, 250=0.01%, 500=0.01%
  lat (usec)   : 2=0.01%, 10=0.01%, 20=0.01%, 50=0.01%, 100=0.02%
  lat (usec)   : 250=1.68%, 500=24.10%, 750=21.64%, 1000=18.24%
  lat (msec)   : 2=27.58%, 4=6.42%, 10=0.32%, 20=0.01%, 50=0.01%
  cpu          : usr=1.38%, sys=11.61%, ctx=9160305, majf=0, minf=0
  IO depths    : 1=100.0%, 2=0.0%, 4=0.0%, 8=0.0%, 16=0.0%, 32=0.0%, >=64=0.0%
     submit    : 0=0.0%, 4=100.0%, 8=0.0%, 16=0.0%, 32=0.0%, 64=0.0%, >=64=0.0%
     complete  : 0=0.0%, 4=100.0%, 8=0.0%, 16=0.0%, 32=0.0%, 64=0.0%, >=64=0.0%
     issued rwts: total=0,9077655,0,0 short=0,0,0,0 dropped=0,0,0,0
     latency   : target=0, window=0, percentile=100.00%, depth=1

Run status group 0 (all jobs):
  WRITE: bw=197MiB/s (207MB/s), 197MiB/s-197MiB/s (207MB/s-207MB/s), io=34.6GiB (37.2GB), run=180004-180004msec

Disk stats (read/write):
  pmem0: ios=0/0, merge=0/0, ticks=0/0, in_queue=0, util=0.00%
毕竟这货是ES版本。
根据xx提供的测试报告
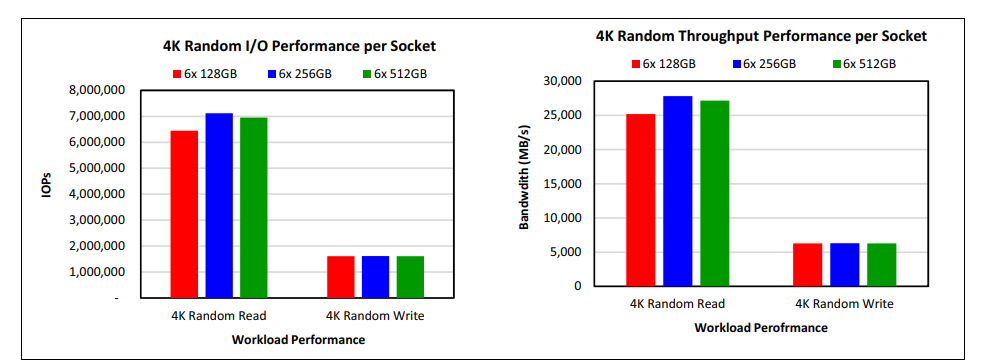
正式版的傲腾,4k随机读取能够跑600万iops。而这个垃圾的货,只能跑100万iops。
PVE上使用傲腾DCPMM
那么性能体验完毕,我们来看一下DCPMM在PVE上表现。
目前PVE 网页上并不支持傲腾。
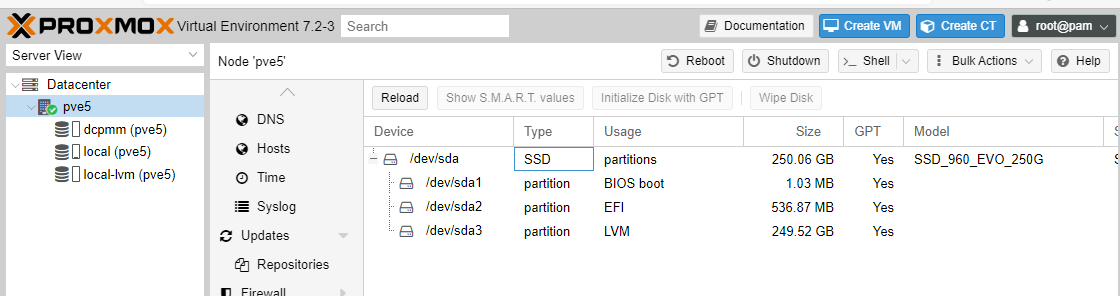
我们只能手动创建磁盘分区了。
创建一个ext4分区,创建一个64G的RAW磁盘。使用ubuntu 22.04来测试。
下面是测试结果

读取和写入都很不理想。
不知是否是scsi带宽的限制。
版权声明:
作者:佛西
链接:https://foxi.buduanwang.vip/uncategorized/1847.html/
文章版权归作者所有,未经允许请勿转载
如需获得支持,请点击网页右上角
作者:佛西
链接:https://foxi.buduanwang.vip/uncategorized/1847.html/
文章版权归作者所有,未经允许请勿转载
如需获得支持,请点击网页右上角
THE END
0
二维码
海报
Proxmox VE 与DCPMM
我心心念念的dcpmm 终于大船靠岸了。
今年4月买了2个板子+es的dcpmm。主板点不亮,拿去卖家,折腾2个月,发现是带载调压,换了电源之后,顺利亮机。
我们先看……
文章目录
关闭
共有 0 条评论